Editor's note: This story is part of the WardsAuto digital archive, which may include content that was first published in print, or in different web layouts.
U.S. EPA fleet fuel-economy data for the ’13 model year shows most automakers gained from ’12, with the industry’s average at 24.1 mpg (9.8 L/100 km), up 0.5 mpg (0.2 km/L).
“Automakers have not really thrown in the towel, they’ve flourished,” says Gina McCarthy, EPA administrator, of how the industry is meeting the government’s challenge to build and sell even more fuel-efficient vehicles.
Mazda repeated from ’12 as the top manufacturer, with a fleet average of 28.1 mpg (8.4 L/100 km), up from 27.1 mpg (8.7 L/100 km).
Honda also held on to second place, growing its fleet average from 26.6 mpg (8.8 L/100 km) in ’12 to 27.4 mpg (8.6 L/100 km) in ’13.
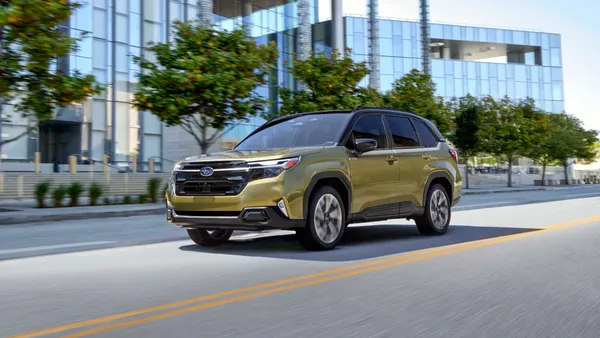
Subaru and Nissan took third and fourth places, respectively, with Nissan touting its finish as the best among full-line manufacturers. Mazda, Honda and Subaru lack the large SUVs and pickup trucks that Nissan sells in the U.S.
Volkswagen, Toyota, BMW, Daimler, Ford, GM and Chrysler-Fiat rounded out the rest of the list, with VW’s ’13 fleet fuel economy at 25.7 mpg (9.2 L/100 km) and Chrysler-Fiat’s at 20.9 mpg (11.3 L/100 km).
Toyota and Ford were the only two automakers to see a reduction from ’12 to ’13. Toyota’s fleet number fell 0.5 mpg to 25.1 mpg (9.4-L/100 km) and Ford lost 0.6 mpg (0.3 km/L) from ’12, with a ’13 fleet number of 22.2 mpg (10.6 L/100 km).
Ford and Toyota also had higher carbon-dioxide emissions, which the EPA puts down to “increases in truck-production share” at both automakers.
Vehicles emitted 369 g/mi of CO2 on average in ’13, 7 g/mi lower than the 376 g/mi average in the ’12 model year.
Both fuel economy and emissions figures are adjusted by the EPA to reflect real-world performance and therefore not comparable to compliance targets, the agency says.
Hyundai/Kia was not ranked in this year’s list due to an ongoing investigation regarding fuel-economy restatements begun in November 2012 at both brands, owned by Hyundai of South Korea. However, their figures are reflected in the ’13 industry figure of 24.1 mpg.
Figures using corrected data and placed in a footnote show Hyundai would have led the industry with a 29.0-mpg (8.1-L/100 km) average for ’13, and Kia would have tied with Honda at 27.4 mpg.
Because of Hyundai/Kia’s longer-than-usual ’13MY, which the EPA contends was due to fuel-economy recalculations, it has little ‘14MY data on Hyundais and Kias, skewing the ’14 fleet industry prediction, says Chris Grundler, director of the EPA’s Office of Transportation and Air Quality in Ann Arbor.
The EPA predicts an industry fleet fuel economy of 24.2 mpg (9.7 L/100 km) for ’14, but McCarthy echoes Grundler, calling that figure “a very conservative projection.”
Grundler and McCarthy both point to automakers achieving these fuel-economy increases largely through commonplace technologies or techniques, such as turbocharging and light-weighting of vehicles.
Electrification and stop/start systems, for instance, have yet to fully take hold, and thus both EPA officials are hopeful of the industry achieving the 54.5-mpg (4.3 L/100 km) CAFE bogey in 2025.
Grundler notes the ’14 Mazda6 midsize car, for instance, already meets the fuel-economy target set by the EPA for model year ’19.
Meanwhile, the EPA continues to emphasize the robustness of its fuel-economy test procedures, and that projected fuel economy on window stickers usually is on par with what consumers are getting.
In a separate conference call Oct. 7, EPA Senior Policy Advisor Jeff Alson says, “While no single label can be right for everyone…we get far fewer complaints from consumers” than the agency did prior to the 2008 realignment of testing.
That year, the EPA added three more tests to account for a wider range of real-world driving behavior and ambient conditions.
Alson also cites recent studies of driver-reported fuel-economy figures on the EPA’s fueleconomy.gov website as bolstering its procedures.
In most instances, driver-reported figures were on par with EPA averages, with Alson citing the ’10 Toyota Prius as an example.
The EPA combined average for the ’10 Prius was 50 mpg (4.7 L/100 km), and the consumer-reported average was 49.4 mpg (4.8 L/100 km), Alson says.
The agency is increasing audits of certain data points provided by automakers. Most EPA tests are not performed by the EPA but rather by automakers following agency standards.
Because many automakers use pre-production data to determine window stickers when a vehicle goes on sale, figures may differ if the same test were to be performed on a production model, Alson says.


